At my company, we recently experienced intermittent crashes/restarts on one of the ASP.Net applications which I help to develop and administrate. While it took me several hours to get to the bottom of the problem, I was finally able to solve it using the following sequence of steps.
Step 1: Is there a problem?
At my company, we are using NewRelic to monitor our production ASP.Net server. Both in NewRelic and in usage of our application, we were noticing that the program would stop responding for a minute or two at a time, but would then start responding again shortly thereafter. When checking the server CPU and memory levels, we did not notice any persistent issues. When checking the event log, we found cryptic errors saying
Faulting application w3wp.exe, version 7.0.6002.18005, time stamp 0x49e023cf,
faulting module kernel32.dll, version 6.0.6002.19034, time stamp 0x52f2ecb1,
exception code 0xe053534f, fault offset 0x0001e743, process id 0x%9,
application start time 0x%10.
A Google search of 0xe053534f led to blog posts online
indicating that the problem was a StackOverflow exception. This post also indicated that we
should be seeing two entries in the event log – the error and an entry from Windows Error Reporting
including the link to a folder with additional details. This phantom second entry was not found
(perhaps because the server is not configured to send these reports to Microsoft?). However, the
post did indicate that the error reporting data data was in the directory
C:\ProgramData\Microsoft\Windows\WER\ReportQueue\.
Step 2: Windows Error Reporting
It turns out that you can view the Windows Error Reports in the Windows user interface. Simply
search the Start Menu for Problem Reports and Solutions. In the Tasks along the left, select
View problem history. Here you can view a list of recent reports including the offending
application and the time of the report which you can correlate with your event log entry. While
you might be able to get all the information you need from the user interface, I found it easiest
to correlate the timestamps in the interface with the folders in C:\ProgramData\Microsoft\Windows\WER\ReportQueue\.
Examining the folders, I found files of types *.mdmp and *.hdmp which turn out to be mini
and full memory dumps respectively.
Step 3: Viewing Memory Dumps
While there are likely many applications for analyzing memory dumps, it appears that the quintessential one is WinDbg available from Microsoft as part of the Windows Driver Kit (or as a separate download). To begin, you need to install the correct version of WinDbg for you operating system. Once that is complete, it is time to set up your environment. Diary of a Ninja has a good write-up on this. Otherwise, the general steps are
Directories
Create a directory structure on your computer that looks something like
C:\Debug
C:\Debug\MemoryDumps
C:\Debug\Symbols
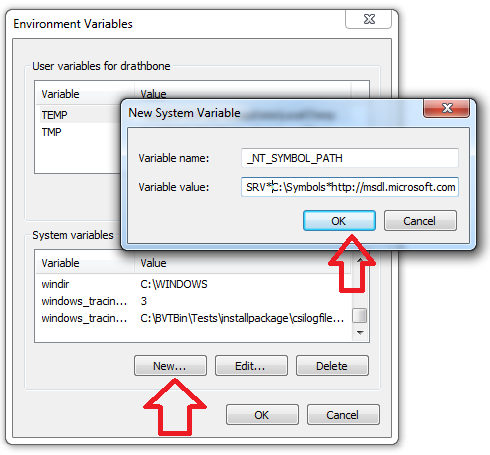
Environmental Variables
Create an environmental variable named _NT_SYMBOL_PATH and set it’s value to
SRV*C:\Debug\Symbols*http://msdl.microsoft.com/download/symbols;C:\Debug\MemoryDumps
Note: I am assuming you are using the directories outlined above. Otherwise, the general structure of the command is
SRV*[LOCATION TO STORE CACHE]*[PATH TO SYMBOLS SEPARATED BY SEMI-COLONS]
Copying files
Copy the following file’s to your C:\Debug\MemoryDumps folder:
- Your server’s
SOS.dll. This is available at the pathC:\Windows\Microsoft.NET\[Framework or Framework64]\[Framework Version #]\SOS.dll. - Your application’s PDB files.
- Your memory dump. (Remember the
*.hdmpfile in the Windows Error Reporting directory from earlier?) - For .Net 2-3.5 Analysis:
- Your server’s
mscordacwks.dll. This is available at the pathC:\Windows\Microsoft.NET\[Framework or Framework64]\[Framework Version #]\mscordacwks.dll.
- Your server’s
- For .Net 4+ Analysis:
- Your server’s
msdacwrks.dll. This is available at the pathC:\Windows\Microsoft.NET\[Framework or Framework64]\[Framework Version #]\msdacwrks.dll. - Your server’s
clr.dll. This is available at the pathC:\Windows\Microsoft.NET\[Framework or Framework64]\[Framework Version #]\clr.dll
- Your server’s
If you are having trouble getting the correct dll versions for your server, the
chentiangemalc blog
might be useful. Also, during analysis, you might receive an error message about not being able to
find the correct version of a particular dll. In the error message it might give you a name of the
dll with a version to use. In this case, you can create a copy of the dll (assuming it is of the
correct version) in the MemoryDumps folder to circumvent the problem. For example, I ended up
having to rename msdacwrks.dll to mscordacwks_x86_x86_2.0.50727.4253.dll for my environment.
Step 4: Dealing with .Net 3.5
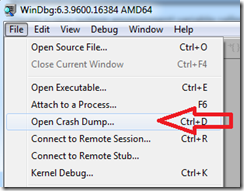
Now you have launched WinDbg and opened the crash dump (File > Open Crash Dump). Diary of a Ninja would have you run the commands
.symfix
.reload
.loadby sos clr

However, these commands are specific to .Net 4+. Unfortunately, I was debugging a .Net 3.5 application. For .Net 3.5 (the 2.0 version of the CLR), Microsoft would have me replace the last command with
.loadby sos mscorwks
However, that still didn’t work for me. What did work was following the advice from Kirk Evans to download the Psscor2 extension for WinDbg from Microsoft. Per Kirk’s directions, I unzipped the download to
C:\Debug\psscor2
Step 5: Analyzing the Dump
Putting this all together, analyzing the dump was now possible by
- Lanching WinDbg and opening the dump (File > Open Crash Dump).
- Loading
psscor2using the command.load C:\Debug\psscor2\x86\psscor2.dllsince I needed the 32-bit version - Analyzing the dump with the command
!analyze -v
This was enough to give me a useful stack trace from which I could identify the problem and fix the bug